
Mobile ecommerce statistics show that smartphones now generate most retail traffic in major benchmarks, while mobile also accounts for most sales in several merchant and holiday datasets. Contentsquare measured mobile at 77% of retail site traffic in 2025, and Adobe found smartphones generated 56.4% of U.S. online holiday revenue in the 2025 season. This report covers traffic, sales, conversion, apps, payments, checkout, retention, acquisition, and regional growth.
In This Article
- Key stats at a glance
- Mobile ecommerce statistics on traffic and device share
- Mobile ecommerce sales and revenue benchmarks
- Mobile holiday shopping statistics
- Mobile conversion, retention, and order benchmarks
- Mobile shopping app statistics
- Mobile app engagement and acquisition statistics
- Mobile payments and digital wallet statistics
- Mobile checkout and user experience statistics
- Mobile commerce growth and regional statistics
- How these statistics were compiled
- FAQ
Quick answer: Mobile generated 77% of retail site traffic in Contentsquare’s 2025 benchmark, while smartphones produced 56.4% of U.S. online holiday revenue in Adobe’s 2025 season (Source: Contentsquare, 2026; Adobe, 2026).
Key stats at a glance
- Mobile generated 77% of retail site traffic in 2025. (Source: Contentsquare, 2026)
- Smartphones generated 56.4% of U.S. online holiday revenue in the 2025 season. (Source: Adobe, 2026)
- Mobile produced 70% of global and U.S. Cyber Week 2025 online orders. (Source: Salesforce, 2025)
- Digital wallets accounted for 56% of global ecommerce transaction value in 2025. (Source: Worldpay, 2026)
- The average ecommerce cart abandonment rate was 70.19% in Baymard’s 2026 benchmark. (Source: Baymard, 2026)
Mobile ecommerce statistics on traffic and device share
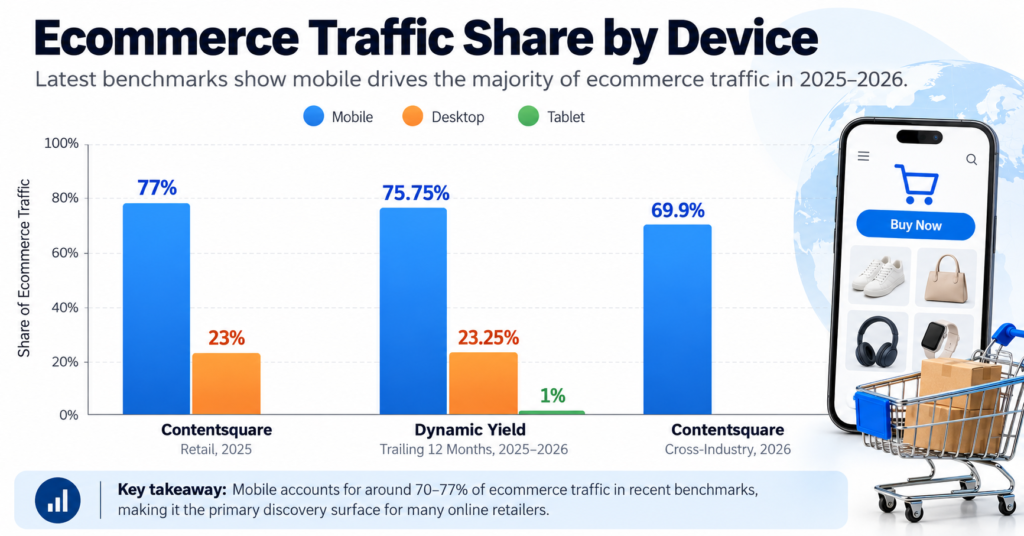
Mobile traffic is the clearest sign that shopping discovery has shifted to phones. These mobile ecommerce statistics separate traffic share from order share, because the two measures answer different questions. Retailers should read device mix beside conversion and revenue rather than treat a high mobile visit share as proof of equal purchasing efficiency.
- Contentsquare’s 2025 retail dataset found that mobile devices generated 77% of retail site traffic. (Source: 2025-2026 publisher data)
- Desktop generated the remaining 23% of retail site traffic in Contentsquare’s 2025 retail benchmark. (Source: 2025-2026 publisher data)
- Dynamic Yield’s trailing 12-month benchmark put mobile at 75.75% of ecommerce visitors. (Source: 2025-2026 publisher data)
- Dynamic Yield measured desktop at 23.25% of ecommerce visitors over the same trailing 12 months. (Source: 2025-2026 publisher data)
- Tablets represented 1% of ecommerce visitors in Dynamic Yield’s trailing 12-month benchmark. (Source: 2025-2026 publisher data)
- In July 2026, Dynamic Yield measured mobile at 74% of ecommerce traffic. (Source: 2025-2026 publisher data)
- July 2026 mobile traffic was 2 percentage points lower than June in Dynamic Yield’s benchmark. (Source: 2025-2026 publisher data)
- Contentsquare’s broader 2026 benchmark measured mobile at 69.9% of traffic across industries. (Source: 2025-2026 publisher data)
- Salesforce reported that mobile generated 79% of global holiday ecommerce traffic during the 2024 holiday season. (Source: 2025-2026 publisher data)
- Salesforce said the 79% global mobile traffic share in the 2024 holiday season was unchanged year over year. (Source: 2025-2026 publisher data)
- Salesforce reported that mobile devices initiated $842 billion in global holiday online sales in the 2024 season. (Source: 2025-2026 publisher data)
- Salesforce reported that mobile devices initiated $195 billion in U.S. holiday online sales in the 2024 season. (Source: 2025-2026 publisher data)
- During Cyber Week 2025, Salesforce measured mobile at 70% of online orders globally. (Source: 2025-2026 publisher data)
- During Cyber Week 2025, Salesforce also measured mobile at 70% of online orders in the United States. (Source: 2025-2026 publisher data)
- In the 2024 holiday season, Salesforce measured mobile orders at nearly 70% of global online orders. (Source: 2025-2026 publisher data)
Mobile ecommerce statistics by traffic source device, recent benchmarks
| Benchmark | Mobile | Desktop | Tablet |
| Contentsquare retail, 2025 | 77% | 23% | n/a |
| Dynamic Yield trailing 12 months | 75.75% | 23.25% | 1% |
| Contentsquare cross-industry, 2026 | 69.9% | n/a | n/a |
Source: Contentsquare 2026 Digital Experience Benchmarks and Dynamic Yield XP² benchmark, 2026.
Taken together, these mobile ecommerce statistics show why mobile should be treated as the primary discovery surface for many retailers. The next step is to compare traffic share with completed orders, revenue per session, and returning-user behavior.
Mobile ecommerce sales and revenue benchmarks
Revenue data shows that mobile already carries most sales in several merchant and seasonal datasets. These mobile ecommerce statistics also show that the exact share changes by market, month, and measurement method. IRP reflects a specific merchant base, while Adobe measures U.S. holiday ecommerce, so the figures are best used as benchmarks rather than a single universal share.
- IRP Commerce measured mobile at 62.6% of ecommerce sales in May 2026 across its merchant benchmark. (Source: 2025-2026 publisher data)
- IRP Commerce measured mobile at 63.5% of ecommerce sales in June 2026. (Source: 2025-2026 publisher data)
- Desktop represented 35% of ecommerce sales in IRP Commerce’s June 2026 benchmark. (Source: 2025-2026 publisher data)
- Tablets represented 1.4% of ecommerce sales in IRP Commerce’s June 2026 benchmark. (Source: 2025-2026 publisher data)
- IRP Commerce measured mobile at 62.3% of ecommerce sales in July 2026. (Source: 2025-2026 publisher data)
- Desktop represented 36.3% of ecommerce sales in IRP Commerce’s July 2026 benchmark. (Source: 2025-2026 publisher data)
- Tablets again represented 1.4% of ecommerce sales in IRP Commerce’s July 2026 benchmark. (Source: 2025-2026 publisher data)
- Mobile’s IRP sales share increased 0.9 percentage points from May to June 2026. (Source: 2025-2026 publisher data)
- Mobile’s IRP sales share decreased 1.2 percentage points from June to July 2026. (Source: 2025-2026 publisher data)
- July 2026 mobile sales share remained 26.0 percentage points above desktop in the IRP benchmark. (Source: 2025-2026 publisher data)
- Adobe measured $257.8 billion in U.S. online spending during the 2025 holiday season. (Source: 2025-2026 publisher data)
- U.S. online holiday spending increased 6.8% year over year in 2025, according to Adobe. (Source: 2025-2026 publisher data)
- Adobe recorded 25 days with more than $4 billion in U.S. online spending during the 2025 holiday season. (Source: 2025-2026 publisher data)
- The comparable count was 18 days in the 2024 holiday season, according to Adobe. (Source: 2025-2026 publisher data)
- Cyber Week 2025 generated $44.2 billion in U.S. online spending in Adobe’s dataset. (Source: 2025-2026 publisher data)
- Cyber Week 2025 online spending increased 7.7% year over year. (Source: 2025-2026 publisher data)
- Cyber Monday 2025 generated $14.25 billion online in the United States. (Source: 2025-2026 publisher data)
- Cyber Monday 2025 online spending increased 7.1% year over year. (Source: 2025-2026 publisher data)
Mobile ecommerce statistics for IRP sales share by device
| Month, 2026 | Mobile | Desktop | Tablet |
| May | 62.6% | n/a | n/a |
| June | 63.5% | 35.0% | 1.4% |
| July | 62.3% | 36.3% | 1.4% |
Source: IRP Commerce, May to July 2026.
These mobile ecommerce statistics show that sales share can move by several points even across adjacent months. A retailer should benchmark against a comparable geography and merchant set, then track its own device revenue mix on the same definitions.
Mobile holiday shopping statistics
Holiday periods provide unusually detailed device data because large analytics platforms publish daily and seasonal recaps. These mobile ecommerce statistics show smartphones taking a larger share of U.S. online revenue in 2025, with the highest mobile share appearing on major holidays. Promotional periods also show strong wallet use and large order volumes.
- Smartphones generated 56.4% of U.S. online holiday revenue from November 1 through December 31, 2025. (Source: 2025-2026 publisher data)
- The smartphone share of U.S. holiday ecommerce revenue was 54.5% in 2024, according to Reuters. (Source: 2025-2026 publisher data)
- Mobile’s holiday revenue share gained 1.9 percentage points from 2024 to 2025. (Source: 2025-2026 publisher data)
- On Christmas Day 2025, smartphones generated 66.5% of U.S. online sales. (Source: 2025-2026 publisher data)
- Christmas Day mobile share was 65% in 2024. (Source: 2025-2026 publisher data)
- Christmas Day mobile share gained 1.5 percentage points year over year in 2025. (Source: 2025-2026 publisher data)
- On Thanksgiving Day 2025, smartphones generated 61.6% of U.S. online sales. (Source: 2025-2026 publisher data)
- Thanksgiving Day mobile share was 59.3% in 2024. (Source: 2025-2026 publisher data)
- Thanksgiving Day mobile share gained 2.3 percentage points year over year in 2025. (Source: 2025-2026 publisher data)
- Salesforce measured mobile wallets on 27% of global Cyber Week 2025 online orders. (Source: 2025-2026 publisher data)
- Salesforce measured mobile wallets on 29% of U.S. Cyber Week 2025 online orders. (Source: 2025-2026 publisher data)
- The U.S. mobile-wallet order share during Cyber Week was 2 percentage points higher than the global share. (Source: 2025-2026 publisher data)
- Salesforce reported $79 billion in global Black Friday 2025 online sales. (Source: 2025-2026 publisher data)
- Global Black Friday 2025 online sales increased 6% year over year. (Source: 2025-2026 publisher data)
- Salesforce reported $18 billion in U.S. Black Friday 2025 online sales, as reported by AP. (Source: 2025-2026 publisher data)
Mobile ecommerce statistics for U.S. holiday revenue share
| Holiday measure | 2024 | 2025 |
| Full holiday season mobile share | 54.5% | 56.4% |
| Christmas Day mobile share | 65.0% | 66.5% |
| Thanksgiving Day mobile share | 59.3% | 61.6% |
Source: Adobe Analytics, 2025 holiday season recap published January 2026.
These mobile ecommerce statistics make holiday planning especially useful for testing mobile checkout, wallet support, and campaign landing pages. Peak days push a larger share of demand onto smartphones, so small mobile defects can affect a larger pool of transactions.
Mobile conversion, retention, and order benchmarks
Traffic dominance does not guarantee equal conversion. These mobile ecommerce statistics show desktop retaining an advantage in purchase completion even as mobile accounts for most visits. Category mix matters too: lower-consideration categories can convert far above luxury, while returning visitors generally outperform new visitors.
- Contentsquare measured a 2.0% mobile conversion rate for retail sites in its 2026 benchmark. (Source: 2025-2026 publisher data)
- Contentsquare measured a 3.7% desktop conversion rate for retail sites in the same benchmark. (Source: 2025-2026 publisher data)
- Desktop retail conversion was 1.7 percentage points higher than mobile in Contentsquare’s benchmark. (Source: 2025-2026 publisher data)
- Contentsquare found that overall retail conversion declined 5.5% year over year. (Source: 2025-2026 publisher data)
- Mobile retail conversion declined 3.5% year over year. (Source: 2025-2026 publisher data)
- Desktop retail conversion declined 8% year over year. (Source: 2025-2026 publisher data)
- New-visitor retail conversion declined 8.9% year over year. (Source: 2025-2026 publisher data)
- Returning-visitor retail conversion declined 4% year over year. (Source: 2025-2026 publisher data)
- Health and Beauty mobile conversion reached 3.4% in Contentsquare’s retail benchmark. (Source: 2025-2026 publisher data)
- Luxury mobile conversion was 0.9% in Contentsquare’s retail benchmark. (Source: 2025-2026 publisher data)
- Luxury desktop conversion was 1.4% in the same retail benchmark. (Source: 2025-2026 publisher data)
- Grocery desktop conversion reached 11.4% in Contentsquare’s retail benchmark. (Source: 2025-2026 publisher data)
- Contentsquare found desktop conversion outperformed mobile by 40% to 70% across retail sub-industries. (Source: 2025-2026 publisher data)
- Retail brands with the highest share of returning visitors achieved 35% higher conversion rates. (Source: 2025-2026 publisher data)
- Returning visitors accounted for 51% of retail traffic in Contentsquare’s 2025 data. (Source: 2025-2026 publisher data)
- Consumer Electronics reached a 60% returning-visitor share. (Source: 2025-2026 publisher data)
- Appliances and Household Goods had a 36.7% returning-visitor share. (Source: 2025-2026 publisher data)
- Mobile retention increased 23% year over year in Contentsquare’s retail benchmark. (Source: 2025-2026 publisher data)
Mobile ecommerce statistics for retail conversion benchmarks
| Benchmark | Mobile | Desktop |
| Overall retail conversion | 2.0% | 3.7% |
| Luxury conversion | 0.9% | 1.4% |
| Year-over-year conversion change | -3.5% | -8.0% |
Source: Contentsquare 2026 Digital Experience Benchmarks, retail data.
These mobile ecommerce statistics point to a cross-device purchase journey rather than a simple mobile-versus-desktop contest. Mobile earns the visit more often, while desktop can still win the final conversion in higher-consideration categories.
Mobile shopping app statistics
Shopping apps add another layer to mobile commerce because they capture repeat sessions, saved preferences, loyalty behavior, and direct re-engagement. These mobile ecommerce statistics show a mixed acquisition picture in 2025: installs softened globally, but sessions held up better, and several emerging markets recorded strong growth.
- Adjust reported that global ecommerce app installs increased 16% year over year in 2024. (Source: 2025-2026 publisher data)
- Global ecommerce app sessions increased 13% year over year in 2024, according to Adjust. (Source: 2025-2026 publisher data)
- In H1 2025, global ecommerce app installs declined 14% year over year. (Source: 2025-2026 publisher data)
- In H1 2025, global ecommerce app sessions increased 2% year over year. (Source: 2025-2026 publisher data)
- Shopping-app installs declined 18% year over year in H1 2025. (Source: 2025-2026 publisher data)
- Shopping-app sessions declined 1% year over year in H1 2025. (Source: 2025-2026 publisher data)
- LATAM ecommerce app installs increased 18% year over year in H1 2025. (Source: 2025-2026 publisher data)
- LATAM ecommerce app sessions increased 27% year over year in H1 2025. (Source: 2025-2026 publisher data)
- APAC ecommerce app installs increased 13% year over year in H1 2025. (Source: 2025-2026 publisher data)
- APAC ecommerce app sessions increased 2% year over year in H1 2025. (Source: 2025-2026 publisher data)
- Thailand ecommerce app installs increased 180% year over year in H1 2025. (Source: 2025-2026 publisher data)
- Thailand ecommerce app sessions increased 53% year over year in H1 2025. (Source: 2025-2026 publisher data)
- Brazil ecommerce app installs increased 48% year over year in H1 2025. (Source: 2025-2026 publisher data)
- Brazil ecommerce app sessions increased 38% year over year in H1 2025. (Source: 2025-2026 publisher data)
- Malaysia ecommerce app installs increased 12% year over year in H1 2025. (Source: 2025-2026 publisher data)
- Malaysia ecommerce app sessions increased 69% year over year in H1 2025. (Source: 2025-2026 publisher data)
- Marketplace apps represented 60% of global ecommerce app sessions in H1 2025. (Source: 2025-2026 publisher data)
- Marketplace apps represented 20% of ecommerce app installs in H1 2025. (Source: 2025-2026 publisher data)
- Marketplace apps averaged 1.86 sessions per user on install day in H1 2025. (Source: 2025-2026 publisher data)
- Marketplace apps recorded a 24.8% day-one retention rate in H1 2025. (Source: 2025-2026 publisher data)
Mobile ecommerce statistics for app growth in H1 2025
| Market | Install change | Session change |
| Global ecommerce | -14% | +2% |
| LATAM | +18% | +27% |
| APAC | +13% | +2% |
| Thailand | +180% | +53% |
| Brazil | +48% | +38% |
| Malaysia | +12% | +69% |
Source: Adjust, Shopping App Insights 2025.
These mobile ecommerce statistics suggest that app quality and retention can matter more than raw install growth. Marketplace apps show how a smaller share of installs can still produce a much larger share of sessions.
Mobile app engagement and acquisition statistics
Install-day engagement and paid acquisition help explain where mobile commerce teams are placing money and where users are responding. These mobile ecommerce statistics show modest engagement gains across regions in H1 2026, alongside large shifts in ecommerce user-acquisition and remarketing budgets.
- Adjust measured North American ecommerce install-day sessions per user at 1.34 in H1 2026. (Source: 2025-2026 publisher data)
- North American ecommerce install-day sessions per user were 1.31 in 2025. (Source: 2025-2026 publisher data)
- APAC ecommerce install-day sessions per user increased from 1.41 in 2025 to 1.42 in H1 2026. (Source: 2025-2026 publisher data)
- European ecommerce install-day sessions per user increased from 1.36 to 1.37 in H1 2026. (Source: 2025-2026 publisher data)
- MENA ecommerce install-day sessions per user increased from 1.36 to 1.38 in H1 2026. (Source: 2025-2026 publisher data)
- LATAM ecommerce install-day sessions per user increased from 1.38 in 2025 to 1.40 in H1 2026. (Source: 2025-2026 publisher data)
- AppsFlyer measured $4.6 billion in global ecommerce user-acquisition spend in its 2025 ecommerce report. (Source: 2025-2026 publisher data)
- China-based ecommerce apps accounted for 85% of worldwide iOS user-acquisition spend in AppsFlyer’s 2025 ecommerce dataset. (Source: 2025-2026 publisher data)
- Germany’s iOS ecommerce user-acquisition spend increased 170% year over year from January through May 2025. (Source: 2025-2026 publisher data)
- AppsFlyer said France’s iOS ecommerce user-acquisition spend more than doubled year over year in the same period. (Source: 2025-2026 publisher data)
- Android’s share of ecommerce remarketing increased from 64% to 77% in AppsFlyer’s 2025 report. (Source: 2025-2026 publisher data)
- Web-to-app install flows increased 38% ahead of peak season in AppsFlyer’s ecommerce dataset. (Source: 2025-2026 publisher data)
- Web-to-app install flows increased another 37% in spring 2025. (Source: 2025-2026 publisher data)
- iOS ecommerce fraud rates fell from 30.1% to 25.9% in AppsFlyer’s report. (Source: 2025-2026 publisher data)
- Android ecommerce fraud rates increased from 9.4% to 10.5% in AppsFlyer’s report. (Source: 2025-2026 publisher data)
- AppsFlyer’s 2025 ecommerce study covered 1,600 ecommerce apps. (Source: 2025-2026 publisher data)
- The AppsFlyer ecommerce study covered 3.1 billion paid app installs. (Source: 2025-2026 publisher data)
- The same study covered 26 billion remarketing conversions. (Source: 2025-2026 publisher data)
Mobile ecommerce statistics for install-day engagement
| Region | 2025 sessions/user | H1 2026 sessions/user |
| North America | 1.31 | 1.34 |
| APAC | 1.41 | 1.42 |
| Europe | 1.36 | 1.37 |
| MENA | 1.36 | 1.38 |
| LATAM | 1.38 | 1.40 |
Source: Adjust, H1 2026 app trends update.
These mobile ecommerce statistics show why acquisition reporting needs platform and region splits. A global average can hide large differences in iOS spend, Android remarketing, fraud exposure, and install-day engagement.
Mobile payments and digital wallet statistics
Digital wallets now sit at the center of online payments in many markets. These mobile ecommerce statistics cover transaction-value share, Cyber Week order share, BNPL spending, and app remarketing. Payment figures should not be read as mobile-only unless the source explicitly measures mobile orders or mobile wallets.
- Worldpay reported that digital wallets accounted for 56% of global ecommerce transaction value in 2025. (Source: 2025-2026 publisher data)
- Digital wallets accounted for 33% of global in-person transaction value in 2025. (Source: 2025-2026 publisher data)
- Worldpay’s 2026 consumer research covered more than 63,000 consumers. (Source: 2025-2026 publisher data)
- Worldpay’s 2026 report covered 42 markets. (Source: 2025-2026 publisher data)
- Adobe measured $20.0 billion in U.S. BNPL online spending during the 2025 holiday season. (Source: 2025-2026 publisher data)
- U.S. holiday BNPL spending increased 9.8% year over year in 2025. (Source: 2025-2026 publisher data)
- Salesforce measured mobile wallets on 27% of global Cyber Week 2025 online orders. (Source: 2025-2026 publisher data)
- Salesforce measured mobile wallets on 29% of U.S. Cyber Week 2025 online orders. (Source: 2025-2026 publisher data)
- AppsFlyer reported global app remarketing spend of $31.3 billion in 2025. (Source: 2025-2026 publisher data)
- Remarketing represented 29% of all app marketing investment in AppsFlyer’s 2025 dataset. (Source: 2025-2026 publisher data)
- Remarketing represented 25% of app marketing investment in 2024. (Source: 2025-2026 publisher data)
- Global app remarketing spend increased 37% year over year in 2025. (Source: 2025-2026 publisher data)
Mobile ecommerce statistics for digital payments
| Payment measure | 2025 share/value |
| Digital wallets, global ecommerce value | 56% |
| Digital wallets, global in-person value | 33% |
| Mobile wallets, global Cyber Week orders | 27% |
| Mobile wallets, U.S. Cyber Week orders | 29% |
| U.S. holiday BNPL spend | $20.0B |
Source: Worldpay Global Payments Report 2026, Salesforce Cyber Week 2025, Adobe Holiday Shopping Report 2025.
These mobile ecommerce statistics show that payment strategy is now part of mobile experience design. Wallet availability, BNPL, authentication, and regional payment preferences can all affect whether a phone-based checkout reaches completion.
Mobile checkout and user experience statistics
Checkout remains one of the largest measurable sources of lost ecommerce demand. These mobile ecommerce statistics combine abandonment reasons, usability benchmarks, and retail-session frustration signals. The data points to cost visibility, delivery speed, trust, account requirements, technical errors, and form complexity as recurring friction points.
- Baymard’s 2026 cart-abandonment benchmark puts the average ecommerce cart abandonment rate at 70.19%. (Source: 2025-2026 publisher data)
- Baymard found that 42% of U.S. online shoppers abandoned a cart because they were browsing or not ready to buy. (Source: 2025-2026 publisher data)
- Among higher-intent abandoners, 40% cited extra costs such as shipping, tax, or fees. (Source: 2025-2026 publisher data)
- Slow delivery was cited by 20% of higher-intent cart abandoners. (Source: 2025-2026 publisher data)
- Lack of trust with credit-card information was cited by 19% of higher-intent cart abandoners. (Source: 2025-2026 publisher data)
- Forced account creation was cited by 18% of higher-intent cart abandoners. (Source: 2025-2026 publisher data)
- A long or complicated checkout was cited by 17% of higher-intent cart abandoners. (Source: 2025-2026 publisher data)
- Baymard estimates that better checkout design can raise conversion by 35.26% for the average large ecommerce site. (Source: 2025-2026 publisher data)
- Baymard estimates $260 billion in recoverable U.S. and EU ecommerce orders through checkout improvements. (Source: 2025-2026 publisher data)
- Baymard’s checkout benchmark found an average of 39 potential checkout improvements per site. (Source: 2025-2026 publisher data)
- Baymard found that 63% of mobile sites had mediocre or worse checkout UX in its 2025 benchmark. (Source: 2025-2026 publisher data)
- Baymard found that 64% of desktop sites had mediocre or worse checkout UX. (Source: 2025-2026 publisher data)
- Baymard found that 46% of ecommerce apps had mediocre or worse checkout UX. (Source: 2025-2026 publisher data)
- Contentsquare found JavaScript errors caused frustration in 17.8% of retail sessions in 2025. (Source: 2025-2026 publisher data)
- Load-time frustration affected 11.6% of retail sessions in 2025. (Source: 2025-2026 publisher data)
- Rage clicks appeared in 5.3% of retail sessions in 2025. (Source: 2025-2026 publisher data)
- Retail frustration fell 6% year over year in Contentsquare’s 2025 retail dataset. (Source: 2025-2026 publisher data)
- Retail site traffic declined 2.6% from 2024 to 2025 in Contentsquare’s benchmark. (Source: 2025-2026 publisher data)
Mobile ecommerce statistics for checkout friction
| Checkout issue | Share of higher-intent abandoners |
| Extra costs | 40% |
| Slow delivery | 20% |
| Credit-card trust concerns | 19% |
| Forced account creation | 18% |
| Long or complicated checkout | 17% |
Source: Baymard Institute cart abandonment research, 2026 data.
These mobile ecommerce statistics show that checkout losses are not caused by one issue. Cost, trust, delivery, forced accounts, long flows, errors, and slow pages each create separate reasons to leave.
Mobile commerce growth and regional statistics
Regional app data shows that mobile commerce growth is not moving at one speed. These mobile ecommerce statistics cover experience design, festive shopping in India, app-session growth, and acquisition budgets. The strongest gains often appear in engagement, re-engagement, and iOS spending rather than simple download volume.
- Airship analyzed more than 1,000 in-app retail experiences in its 2025 impact study. (Source: 2025-2026 publisher data)
- Airship’s retail impact study covered 1.7 billion device sessions. (Source: 2025-2026 publisher data)
- Customers exposed to Airship’s measured native app experiences purchased 140% more frequently. (Source: 2025-2026 publisher data)
- Special-offer and discount experiences produced a 115% purchase-conversion lift in Airship’s study. (Source: 2025-2026 publisher data)
- Preference-collection experiences produced a 179% purchase-conversion lift. (Source: 2025-2026 publisher data)
- App-update experiences produced a 232% purchase-conversion lift. (Source: 2025-2026 publisher data)
- Push-notification opt-in experiences produced a 432% purchase-conversion lift. (Source: 2025-2026 publisher data)
- AppsFlyer found iOS Shopping session volume in India increased 20% after Diwali in its 2025 festive analysis. (Source: 2025-2026 publisher data)
- Android remarketing spend for Shopping apps in India increased 26% after the festive peak. (Source: 2025-2026 publisher data)
- The top 10 Shopping apps in AppsFlyer’s India study increased their share of paying users by 32% year over year. (Source: 2025-2026 publisher data)
- AppsFlyer’s India festive study analyzed 20.5 million installs. (Source: 2025-2026 publisher data)
- The India festive study covered more than $576 million in user-acquisition and remarketing spend. (Source: 2025-2026 publisher data)
- Similarweb reported ecommerce app sessions increased 13% year over year in 2025 while web visits stayed flat. (Source: 2025-2026 publisher data)
- AppsFlyer reported global app user-acquisition spend reached $78 billion in 2025. (Source: 2025-2026 publisher data)
- Global app user-acquisition spend increased 13% year over year in 2025. (Source: 2025-2026 publisher data)
- Non-gaming app user-acquisition spend reached $53 billion in 2025. (Source: 2025-2026 publisher data)
Mobile ecommerce statistics for app growth signals
| Growth signal | Latest measured change |
| Similarweb ecommerce app sessions | +13% YoY |
| Global app UA spend | +13% YoY |
| Non-gaming app UA spend | +18% YoY |
| iOS UA spend | +35% YoY |
| Android UA spend | -1% YoY |
Source: Similarweb State of Ecommerce 2025 and AppsFlyer 2025 data trends.
These mobile ecommerce statistics show growth shifting from simple acquisition to repeat engagement and reactivation. Retailers comparing markets should separate installs, sessions, paying users, remarketing, and conversion lift before drawing conclusions.
How these statistics were compiled
These mobile ecommerce statistics were compiled from primary publishers and first-party research, including Adobe, Salesforce, IRP Commerce, Contentsquare, Dynamic Yield, Worldpay, Adjust, AppsFlyer, Airship, Baymard Institute, and Similarweb. The working date window was 2025 through September 2026, with 2024 figures included only when a 2025 or 2026 source used them as the direct comparison year. Competitor pages were used to map topic coverage, not as evidence for the numbered figures. Where credible sources measure different scopes, the article keeps the figures separate rather than averaging them. The review was completed in September 2026.
Conclusion
Mobile ecommerce statistics point to three patterns: phones dominate traffic, apps deepen repeat engagement, and mobile checkout still loses demand to friction.
Mobile ecommerce statistics also show that payment choice, retention, and cross-device continuity will shape performance as mobile’s share keeps expanding.
FAQ
What percentage of ecommerce is mobile in 2026?
There is no single global percentage because sources measure traffic, orders, sales, and transaction value differently. For mobile ecommerce statistics, a useful current traffic benchmark is 77% of retail site visits on mobile in Contentsquare’s 2025 retail data, published in 2026. (Source: Contentsquare, 2026)
What share of online shopping happens on smartphones?
During the U.S. 2025 holiday season, smartphones generated 56.4% of online revenue. That mobile ecommerce statistics benchmark rose from 54.5% in 2024 and reached 66.5% on Christmas Day 2025. (Source: Adobe, 2026)
Do mobile shoppers convert less than desktop shoppers?
In Contentsquare’s 2026 retail benchmark, mobile conversion was 2.0% versus 3.7% on desktop. Mobile ecommerce statistics vary by category, so a retailer should compare its own product type and customer mix with the closest benchmark. (Source: Contentsquare, 2026)
What is the mobile cart abandonment rate?
Baymard’s cross-device ecommerce benchmark was 70.19% in its 2026 data, while device-specific rates vary by dataset. These mobile ecommerce statistics are best paired with reason data: 40% of higher-intent abandoners cited extra costs. (Source: Baymard, 2026)
How important are mobile shopping apps?
Adjust found global ecommerce app sessions rose 5% year over year in 2025. Mobile ecommerce statistics also show marketplace and classifieds app sessions increased 7%, indicating that repeat engagement can grow even when install trends are uneven. (Source: Adjust, 2026)
How common are digital wallets in ecommerce?
Worldpay reported digital wallets represented 56% of global ecommerce transaction value in 2025. In mobile ecommerce statistics for Cyber Week 2025, Salesforce measured mobile wallets on 27% of global online orders and 29% of U.S. online orders. (Source: Worldpay, 2026; Salesforce, 2025)
What mobile ecommerce statistics matter most for retailers?
The most useful mobile ecommerce statistics are device traffic share, mobile conversion, revenue share, app retention, checkout abandonment, wallet use, and returning-visitor performance. Contentsquare found returning visitors represented 51% of retail traffic and that brands with the highest returning-visitor share converted 35% better. (Source: Contentsquare, 2026)
Are mobile ecommerce statistics growing faster in apps or on the web?
Recent data points to stronger app engagement in several datasets. Similarweb reported ecommerce app sessions up 13% year over year in 2025 while web visits were flat, making app-versus-web engagement a useful mobile ecommerce statistics comparison. (Source: Similarweb, 2025)