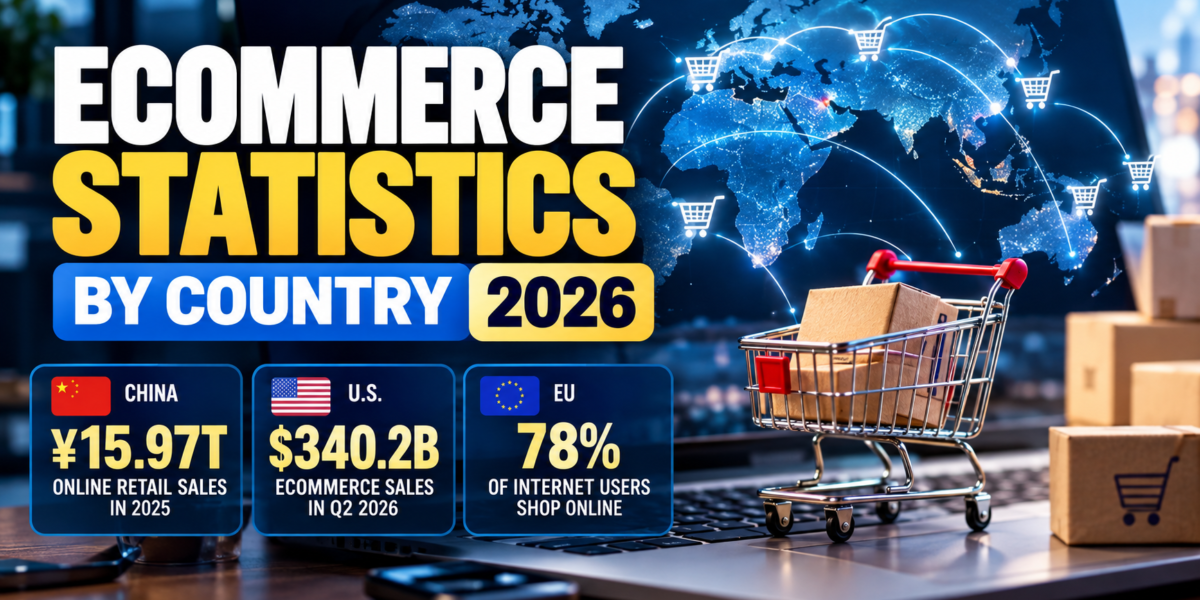
Ecommerce has become a major part of retail worldwide, but online shopping adoption, market size, and growth vary considerably from one country to another. China has one of the world’s largest online retail economies, ecommerce accounts for a significant portion of retail spending in major markets, and online shopping participation exceeds 90% of internet users in some European countries.
In This Article
- Key Ecommerce Statistics
- Ecommerce Statistics by Country
- China Ecommerce Statistics
- United States Ecommerce Statistics
- Canada Ecommerce Statistics
- Ecommerce Statistics in Europe
- Ecommerce Statistics by Age
- Ireland Ecommerce Statistics
- Netherlands Ecommerce Statistics
- Italy Ecommerce Statistics
- Bulgaria Ecommerce Statistics
- Ecommerce Statistics for European Businesses
- What Do People Buy Online?
- Problems Consumers Experience When Shopping Online
- How Quickly Is Ecommerce Growing?
- Which Country Has the Highest Ecommerce Adoption?
- How Ecommerce Statistics Are Measured
- Ecommerce Statistics by Country: Key Takeaways
- Ecommerce Statistics by Country FAQs
However, comparing ecommerce statistics by country isn’t always straightforward. Different statistical agencies measure ecommerce in different ways. Some report online retail sales, while others track ecommerce penetration, online shopper adoption, or total ecommerce transactions.
This guide brings together the latest available ecommerce statistics by country, with a focus on market size, online shopping adoption, ecommerce penetration, and growth.
Key Ecommerce Statistics
Here are some of the most important ecommerce statistics:
- China’s online retail sales reached ¥15.97 trillion in 2025, increasing 8.6% year over year
- Online sales of physical goods in China reached ¥13.09 trillion in 2025
- Physical-goods ecommerce represented 26.1% of China’s total retail sales of consumer goods in 2025
- U.S. seasonally adjusted retail ecommerce sales reached approximately $340.2 billion in Q2 2026
- 78% of EU internet users bought or ordered goods or services online in 2025
- Ireland had the highest online-shopping adoption among EU countries in 2025, at 95% of internet users
- The Netherlands followed Ireland, with 94% of internet users shopping online in 2025
- Canada’s retail ecommerce sales reached C$4.3 billion in December 2025, representing 6.1% of total retail trade
- China’s broader ecommerce transactions reached approximately ¥46.73 trillion in 2025
- 24% of EU businesses reported conducting e-sales in 2025
- Ecommerce generated 19% of total EU business turnover in 2025
Ecommerce Statistics by Country
Ecommerce statistics can measure market size, sales, consumer adoption, or retail penetration. The following table provides a snapshot of some of the latest available country and regional data.
| Country or Market | Latest Ecommerce Statistic | Period | Metric |
| China | ¥15.97 trillion | 2025 | Online retail sales |
| United States | $340.2 billion | Q2 2026 | Quarterly retail ecommerce sales |
| Canada | C$4.3 billion | December 2025 | Monthly retail ecommerce sales |
| Ireland | 95% | 2025 | Internet users shopping online |
| Netherlands | 94% | 2025 | Internet users shopping online |
| Italy | 62% | 2025 | Internet users shopping online |
| Bulgaria | 57% | 2025 | Internet users shopping online |
| European Union | 78% | 2025 | Internet users shopping online |
These figures shouldn’t be treated as a direct ecommerce market-size ranking because they represent different measurements. For example, U.S. and Chinese figures above measure ecommerce sales, while the statistics for Ireland, the Netherlands, Italy, and Bulgaria measure the percentage of internet users who shop online.
China Ecommerce Statistics
China has an enormous online retail economy. Online retail sales in China reached approximately ¥15.97 trillion in 2025, representing an 8.6% increase compared with the previous year. Online sales involving physical products accounted for approximately ¥13.09 trillion, according to Statista. Physical-goods ecommerce represented 26.1% of total retail sales of consumer goods in China during 2025.
China’s broader ecommerce economy is considerably larger when transactions beyond online retail are included. Total ecommerce transactions reached approximately ¥46.73 trillion in 2025, increasing 2.5% year over year.
The difference between these figures is important. Online retail sales primarily measure consumer-facing retail activity, while total ecommerce transactions cover a much broader range of digital commerce.
United States Ecommerce Statistics
The United States remains one of the world’s largest ecommerce markets. Seasonally adjusted U.S. retail ecommerce sales reached approximately $340.2 billion in Q2 2026, according to data from FRED. That’s up from approximately $303.3 billion in Q2 2025.
U.S. Ecommerce Sales by Quarter
| Quarter | Retail Ecommerce Sales |
| Q2 2025 | $303.3 billion |
| Q3 2025 | $310.8 billion |
| Q4 2025 | $318.0 billion |
| Q1 2026 | $327.9 billion |
| Q2 2026 | $340.2 billion |
This means seasonally adjusted U.S. ecommerce sales increased by approximately 12.2% between Q2 2025 and Q2 2026.
U.S. ecommerce statistics generally cover transactions where an order, price, or terms of sale are negotiated through the internet or another online system. Certain categories that aren’t classified as retail — such as some travel and financial services — aren’t included in standard retail ecommerce statistics.
Canada Ecommerce Statistics
Canada also has a well-established ecommerce market. Seasonally adjusted Canadian retail ecommerce sales reached approximately C$4.3 billion in December 2025. Ecommerce represented approximately 6.1% of Canada’s total retail trade that month, compared with 5.8% in November. Retail ecommerce sales increased 3.6% month over month.
Canadian retailers generated approximately C$837.2 billion in total retail sales during 2025, an increase of 4% from 2024.
Ecommerce Statistics in Europe
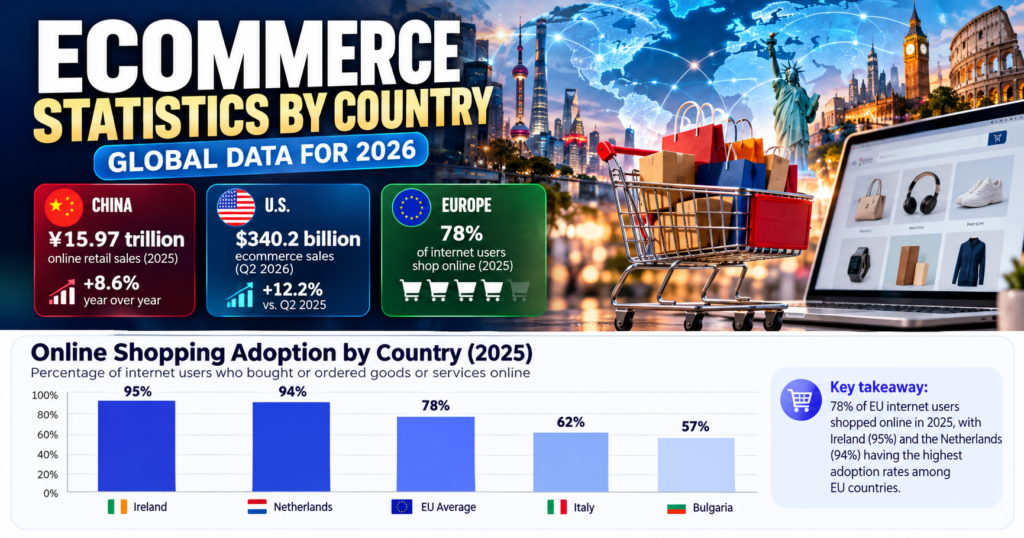
Europe contains some of the world’s most mature online-shopping populations. In 2025, approximately 78% of EU internet users purchased or ordered goods or services online. That’s up substantially from 62% in 2015 — in other words, the proportion of EU internet users shopping online increased by 16 percentage points over a decade.
However, ecommerce adoption differs considerably between individual European countries.
Online Shopping Adoption by EU Country
| Country | Internet Users Shopping Online |
| Ireland | 95% |
| Netherlands | 94% |
| Italy | 62% |
| Bulgaria | 57% |
| EU Average | 78% |
Ireland had the highest rate among EU countries in 2025, while Bulgaria recorded the lowest of the countries included in this comparison. The gap between Ireland and Bulgaria was 38 percentage points.
Ecommerce Statistics by Age
Age remains an important factor in online shopping adoption. In the EU in 2025:
| Age Group | Percentage Shopping Online |
| 16–24 | 84% |
| 25–64 | 81% |
| 65–74 | 55% |
Younger internet users remain more likely to shop online, but ecommerce adoption among older consumers has become substantial. More than half of EU internet users aged 65–74 shopped online in 2025.
Ireland Ecommerce Statistics
Ireland has one of Europe’s highest levels of ecommerce adoption. Approximately 95% of Irish internet users purchased or ordered goods or services online in 2025 — the highest proportion among EU countries.
Ireland also performs strongly in business ecommerce. E-sales represented approximately 38% of total business turnover in Ireland, the highest proportion reported among EU countries in the latest Eurostat data.
Netherlands Ecommerce Statistics
The Netherlands has another highly developed ecommerce market. Approximately 94% of Dutch internet users bought goods or services online in 2025, placing the Netherlands just behind Ireland among EU countries.
The Netherlands has maintained extremely high online-shopping adoption for several years, suggesting ecommerce is already a mainstream purchasing channel for most Dutch internet users.
Italy Ecommerce Statistics
Approximately 62% of Italian internet users purchased goods or services online in 2025 — below the EU average of 78%. Italy therefore had an ecommerce adoption rate approximately 16 percentage points below the EU average.
However, consumer adoption shouldn’t be confused with ecommerce market growth or total online spending. A country can have a lower percentage of consumers shopping online while still operating a substantial ecommerce market.
Bulgaria Ecommerce Statistics
Bulgaria illustrates how much ecommerce adoption can vary even within the same economic region. Approximately 57% of Bulgarian internet users purchased something online in 2025 — the lowest percentage among EU countries in the latest comparison. By comparison, 95% of Irish internet users purchased online, creating a 38-percentage-point difference between the two countries.
However, this doesn’t necessarily mean Bulgaria’s ecommerce market is declining. The statistic measures the proportion of internet users purchasing online rather than ecommerce revenue or annual market growth.
Ecommerce Statistics for European Businesses
Ecommerce isn’t limited to consumer shopping. Businesses increasingly generate revenue through websites, apps, marketplaces, and other electronic sales channels. In 2025, approximately 24% of EU businesses reported conducting e-sales, compared with 19% in 2015.
Large businesses were considerably more likely to sell electronically than smaller companies. Approximately 48% of large EU businesses conducted e-sales, compared with 23% of small and medium-sized businesses.
EU Businesses Conducting E-Sales
| Business Category | Share Conducting E-Sales |
| All EU businesses | 24% |
| Large businesses | 48% |
| SMEs | 23% |
Lithuania recorded the highest proportion of businesses selling online among EU countries, at approximately 43%. It was followed by Denmark at 39%, while Sweden and Ireland each recorded 37%.
Ecommerce Share of Business Revenue
Ecommerce is also responsible for a meaningful share of business turnover. E-sales represented approximately 19% of total EU business turnover in 2025, compared with 16% a decade earlier. The proportion varied considerably by company size: e-sales accounted for approximately 24% of turnover among large businesses, compared with 12% among SMEs.
There were also substantial differences between countries.
Ecommerce Share of Business Turnover
| Country or Market | E-Sales Share of Turnover |
| Ireland | 38% |
| Denmark | 33% |
| Finland | 30% |
| Belgium | 30% |
| EU Average | 19% |
| Latvia | 12% |
| Greece | 9% |
| Bulgaria | 8% |
Ireland therefore generated almost twice the EU-average proportion of business turnover through e-sales.
What Do People Buy Online?
Clothing remains one of the most common online purchases. Among EU consumers who had purchased online during the previous three months in 2024, approximately 70% bought clothes, shoes, or accessories.
Other popular ecommerce categories included:
- Film, series, or sports streaming subscriptions: 46%
- Event tickets: 38%
- Transport services: 38%
- Restaurant deliveries: 33%
- Accommodation: 33%
- Cosmetics: 31%
The popularity of individual product categories also varies significantly between countries.
Problems Consumers Experience When Shopping Online
The growth of ecommerce doesn’t mean consumers always have a seamless experience. Approximately 35% of EU consumers who had recently purchased online reported encountering a problem when shopping through a website or app in 2025.
The most frequently reported problem was slower delivery than promised. Approximately 20% of ecommerce buyers reported delayed delivery, while 11% experienced websites that were difficult to use or didn’t function satisfactorily. Another 10% reported receiving incorrect or damaged goods or services.
These statistics demonstrate that logistics, website usability, and order accuracy remain important areas for ecommerce businesses to improve.
How Quickly Is Ecommerce Growing?
Ecommerce continues to grow across several major markets, although growth rates vary by country and measurement.
China’s online retail sales increased approximately 8.6% in 2025, while online sales specifically involving physical goods increased approximately 5.2%. Meanwhile, U.S. seasonally adjusted retail ecommerce sales increased from approximately $303.3 billion in Q2 2025 to $340.2 billion in Q2 2026.
Europe shows another dimension of ecommerce growth: the proportion of EU internet users shopping online increased from 62% in 2015 to 78% in 2025.
These statistics represent three different ways of measuring ecommerce growth:
- Ecommerce sales growth
- Ecommerce’s share of overall retail
- Consumer adoption of online shopping
All three measurements can provide useful information, but they shouldn’t be treated as interchangeable.
Which Country Has the Highest Ecommerce Adoption?
There isn’t one universal measurement of ecommerce adoption.
If ecommerce adoption is measured as the percentage of internet users purchasing online, Ireland had the highest rate among EU countries in 2025 — approximately 95% of Irish internet users shopped online, followed closely by the Netherlands at 94%.
If adoption is measured as the percentage of retail spending occurring online, the rankings can look very different. For example, online sales of physical goods represented approximately 26.1% of China’s total retail sales of consumer goods in 2025.
This is why ecommerce penetration statistics should always state exactly what is being measured.
How Ecommerce Statistics Are Measured
One of the biggest challenges with global ecommerce statistics is that apparently similar figures can represent very different things.
Retail Ecommerce Sales — Generally measures goods sold online by businesses classified as retailers.
Online Retail Sales — Can include physical products and, depending on the statistical methodology, certain non-physical goods or services.
B2C Ecommerce Market Size — Business-to-consumer ecommerce estimates can include a broader range of products and services than traditional retail statistics.
Gross Merchandise Value (GMV) — Represents the total value of goods transacted through a platform. GMV isn’t necessarily the same as the platform’s revenue.
Total Ecommerce Transactions — Can include activity far beyond consumer retail.
China demonstrates this difference clearly: the country recorded approximately ¥15.97 trillion in online retail sales in 2025, while its broader ecommerce transaction total was approximately ¥46.73 trillion. Both statistics can be accurate while measuring substantially different areas of ecommerce activity.
Ecommerce Statistics by Country: Key Takeaways
The latest ecommerce statistics reveal several major trends.
First, online shopping has become mainstream in many developed ecommerce markets. More than three-quarters of EU internet users now shop online, with adoption exceeding 90% in countries such as Ireland and the Netherlands.
Second, ecommerce continues to represent a substantial portion of retail activity. Online sales of physical products accounted for more than one-quarter of China’s retail sales of consumer goods in 2025.
Third, ecommerce adoption remains uneven. Even within the EU, online-shopping participation ranged from 57% to 95% of internet users in 2025.
Finally, businesses evaluating ecommerce opportunities shouldn’t rely on market size alone. Important factors can include:
- Ecommerce penetration
- Online shopper adoption
- Market growth
- Mobile commerce adoption
- Consumer demographics
- Payment preferences
- Logistics infrastructure
- Cross-border shopping behavior
- Competition
- Average consumer spending
Examining several of these metrics together provides a more complete picture of ecommerce activity in each country.
Ecommerce Statistics by Country FAQs
Which Country Has the Biggest Ecommerce Market?
China and the United States operate exceptionally large ecommerce markets. China recorded approximately ¥15.97 trillion in online retail sales during 2025, while seasonally adjusted U.S. retail ecommerce sales reached approximately $340.2 billion in Q2 2026. Because official statistics use different definitions, currencies, and reporting periods, these figures shouldn’t be compared directly without adjusting for methodology.
What Percentage of People Shop Online?
Approximately 78% of EU internet users bought or ordered goods or services online in 2025. Online-shopping adoption ranged from approximately 57% in Bulgaria to 95% in Ireland.
Which European Country Has the Highest Online Shopping Adoption?
Ireland recorded the highest online-shopping adoption among EU countries in 2025. Approximately 95% of Irish internet users purchased or ordered goods or services online, followed by the Netherlands at 94%.
What Percentage of China’s Retail Sales Are Online?
Online sales of physical goods represented approximately 26.1% of China’s total retail sales of consumer goods in 2025.
How Large Is Ecommerce in the United States?
Seasonally adjusted U.S. retail ecommerce sales reached approximately $340.2 billion during Q2 2026, up from approximately $303.3 billion in Q2 2025.
Is Ecommerce Still Growing?
Yes. Recent official statistics show continued ecommerce growth in several major markets. China’s online retail sales increased 8.6% in 2025, while U.S. seasonally adjusted retail ecommerce sales increased substantially between Q2 2025 and Q2 2026. Across the EU, the proportion of internet users shopping online increased from 62% in 2015 to 78% in 2025.
What Is the Difference Between Ecommerce Sales and GMV?
Ecommerce sales generally refer to revenue generated through online transactions. GMV, or gross merchandise value, measures the total value of goods transacted through a marketplace or platform. A marketplace’s GMV can therefore be much larger than the revenue the marketplace itself records.
Why Do Ecommerce Statistics Differ Between Sources?
Different organizations use different definitions, data-collection methods, currencies, time periods, and market categories. One source may measure retail ecommerce, while another measures B2C ecommerce, marketplace GMV, online shopper adoption, or total ecommerce transactions. For accurate country comparisons, statistics should only be compared when their definitions and measurement periods are reasonably consistent.